American White Pelican with locations spanning 5 UTM zones
Turkey vulture locations only occurring in one UTM zone
How to find coordinates system of GIS layer in ArcCatalog or Table of Contents in ArcMap
Study area projected into UTM Zone 12N with original WGS84 underneath
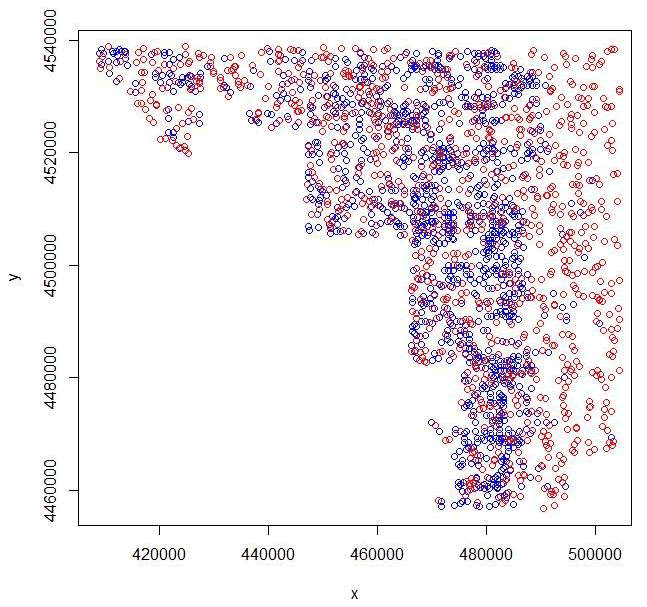
Mule deer locations projected into UTM Zone 12N (red) with original locations in WGS84 (black)
Overlay of mule deer locations with random locations generated in R
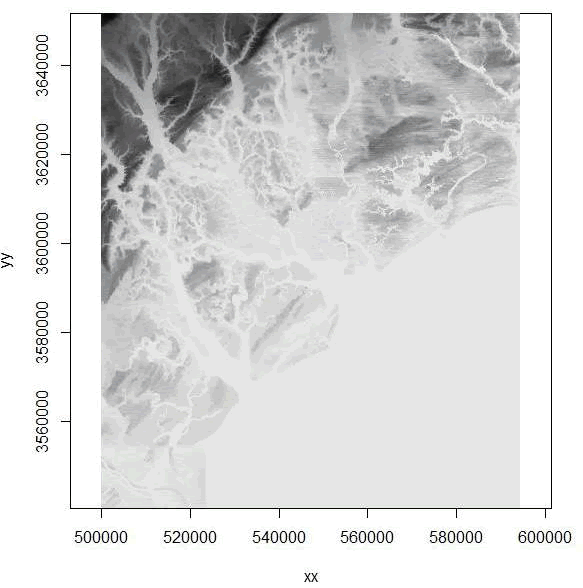
Imported raster dataset showing coastline and tributaries
Imported Digital Elevation Model using adehabitat package showing coastline and tributaries
Buffers around mule deer locations using the a) byid=FALSE (default) and b) byid=TRUE for the gBuffer function using package rgeos
Estimating probability of occupancy of Snowshoe hare across the current range in Pennsylvania, 2004
Example of a trajectory created using adehabitatLT for a mule deer in Colorado
Plot of a First Passage Time for a mule deer in Colorado identifying mean FPT by month
Summaries of distance and time (dt) between relocations for mule deer D16
Bursts of movements for mule deer D15 after creating segements based for focal use areas
Example of KDE with hplug-in smoothing parameter to estimate size of home range for an American White Pelican
Example of 95% BBMM home range for a Florida Panther
Example of 95% KDE home range with hplug-in for a Florida Panther
Example of 95% KDE home range with href for a Florida Panther
This figure shows how to summarize size of home range in ArcMap
Home range of one panther using BBMM showing all contours
Home range using BBMM for panther 110 with various time lags incorporated
Locations of one vulture in UTM 17N
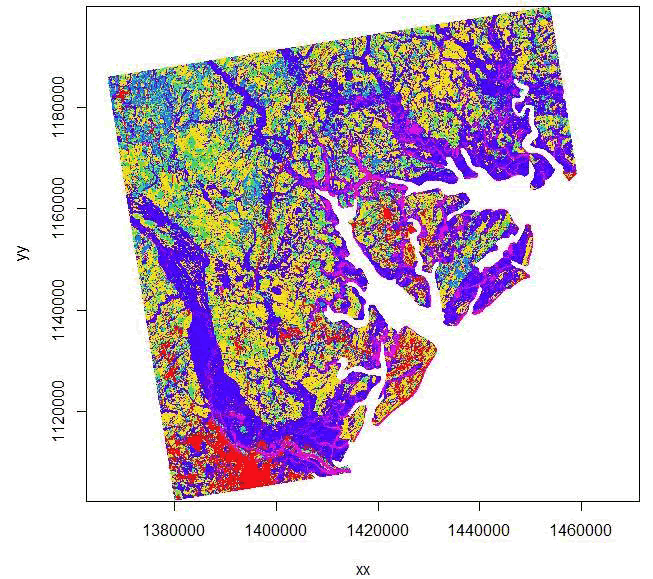
Imported habitat layer in Albers Equal Area Conic Projection
Imported habitat layer projected to UTM Zone 17N similar to vulture locations
Overlay of ltraj on spixdf=habitat in UTM Zone 17N
Imported raster dataset showing coastline and tributaries
Movement paths of two Black Vultures with a similar extent
Red identifies ocean and tributaries not used by vultures
Contours of home range for 2 black vultures estimated using the Movement-based kernel density method (MKDE)
Contours of home range for a mule deer estimated using the dynamic Brownian Bridge Movement Model (dBBMM)
Example of CHP home range for 2 Florida panther
The LoCoH GUI
Example of 95% estimate of home range for a Florida Panther using LoCoH with Fixed K = 1,000
Example of 95% estimate of home range for a Florida Panther using LoCoH with Fixed R = 1,000
Example of 95% KDE estimate of home range for a Florida Panther using LoCoH with Adaptive = 1,000
Example of 95% KDE estimate of home range for a Florida Panther using LoCoH with Adaptive = 10,000
Example of 95% estimate of home range for mule deer using Minimum Convex Polygon
Example of 95% estimate of home range for mule deer using Minimum Convex Polygon with relocations overlayed
Example home range of a mule deer in 3D using KDE with a) href and b) hplug-in bandwidth selection
Example of a Digital Elevation Model in 3D using rasterVis package in R
Zooming in around mule deer locations using drawExtent in the raster package in R
Selection ratios for Florida panther for 6 habitat types (1-6) using Manly’s Selectivity Measure. Habitat type is on x-axis and selectivity measure is on y-axis for a) all panthers and b) each panther
Adjacency matrix created in ArcMap using the Adjacency Toolbox
Compiling the model structure in WinBUGS
Loading the data into WinBUGS
Compiling the number of chains in WinBUGS
Loading the initial values for each chain in WinBUGS
Setting the sample monitor tool and initiating program to run in WinBUGS
